Your Broker Is Hiding Your P&L: How We Fixed Options Spread Reporting
Merrill Edge shows two cryptic ticker codes and contradictory green/red numbers for a put spread. Most traders have no idea if they're up or down. Here's how OptionsMastery solved it with one clean card.
Your Broker Is Hiding Your P&L
I run a portfolio of vertical put spreads. Covered calls. Cash-secured puts. Across multiple brokerages — Fidelity, Merrill Edge, and a few others.
Last week I was trying to answer a simple question: Am I up or down on my SPY put spread?
I opened Merrill Edge. Here's what I saw:
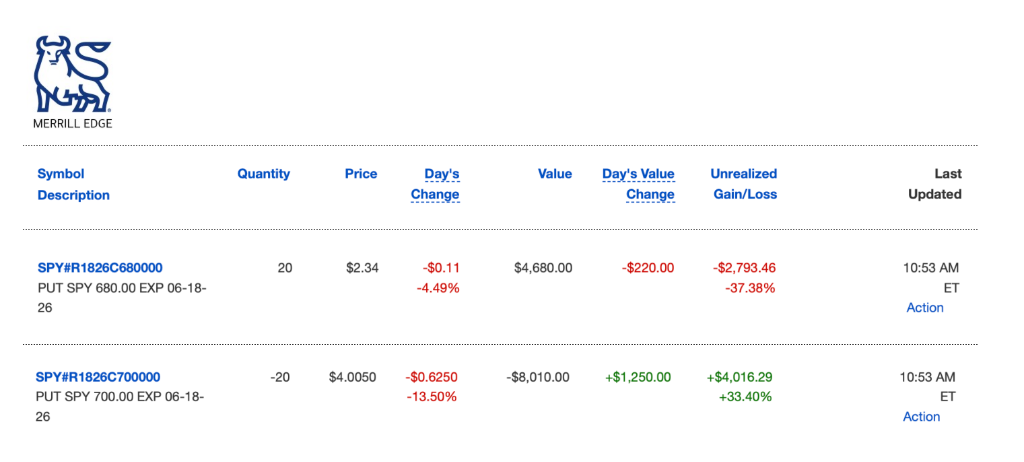
Let me break down exactly what is wrong with this.
The Merrill Edge Problem
Two rows. Two cryptic ticker codes — SPY#R1826C680000 and SPY#R1826C700000. One says -$2,793.46 in red. The other says +$4,016.29 in green.
Which leg did I sell? Which did I buy? You have to look at the negative quantity (-20) to figure that out. And then you have to manually subtract $2,793 from $4,016 in your head to arrive at a net. Then second-guess yourself because "Day's Value Change" is in the opposite color direction.
This is a spread. Two legs designed to work together as a single strategy. But Merrill treats them as two completely independent positions with no connection between them.
Here's what it actually is: I sold 20x 700P (short leg, generates credit) and bought 20x 680P (long leg, protection). The moment I entered this trade, it became a single unit of risk with a defined max profit and a defined max loss. Merrill doesn't know that. Or if it does, it doesn't show it.
The exact numbers from Fidelity's transaction history showed I sold the 700P leg for +$8,010 and bought the 680P leg for -$4,552. Net credit received: $4,552.83. That's my max profit. Everything else is noise.
What Actually Matters in a Spread
When you're managing a vertical put spread, there are exactly five numbers you need to track:
- Entry Credit (Net) — What you collected when you opened the position. This is your max profit.
- Max Loss — The width of the spread minus the credit. Hard ceiling on downside.
- Current Value — What it would cost to close the spread today.
- Total P&L — Entry credit minus current close cost. Your actual realized gain if you exited now.
- % of Max Captured — What percentage of your maximum possible profit have you already locked in?
None of these five numbers appear anywhere in Merrill Edge's interface. You have to compute them yourself by combining information from two separate rows, your transaction history, and a calculator.
How OptionsMastery Solves It
We built a strategy card engine that automatically groups your spread legs and computes every metric you actually need:
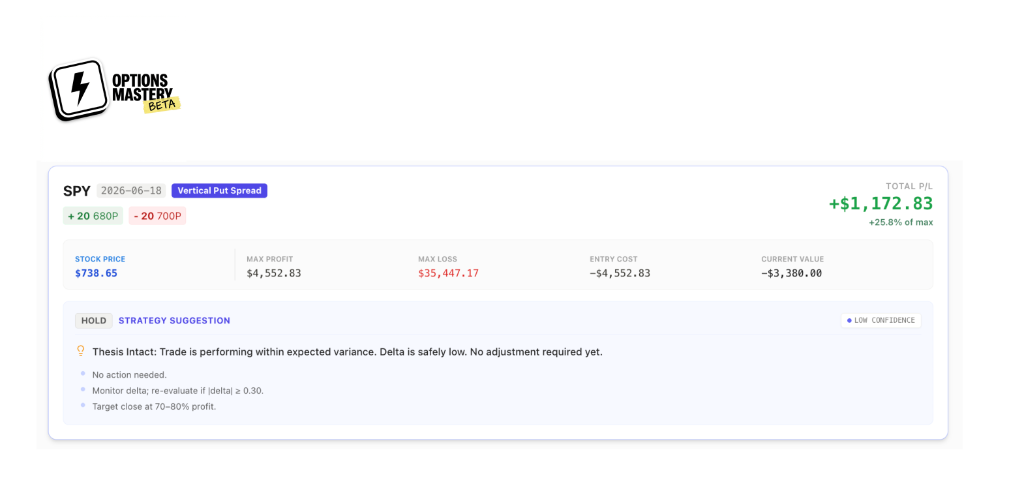
One card. Everything you need:
🏷️ Header Row
- Ticker (SPY) + Expiration (2026-06-18) + Strategy Type (Vertical Put Spread)
- Leg pills:
+20 680Pand-20 700P— color-coded green for long, red for short. At a glance you know exactly what you own. - Total P&L:
+$1,172.83in large green text. And crucially:+25.8% of max— so you know you've captured 26 cents on every dollar of maximum profit.
📊 Stats Row
- Stock Price:
$738.65— live, real-time. Know exactly where SPY is trading without switching tabs. - Max Profit:
$4,552.83— the credit you received. Your ceiling. - Max Loss:
$35,447.17— the worst case. Your floor. - Entry Cost:
-$4,552.83— confirmed net credit (negative = you received money). - Current Value:
-$3,380.00— what it costs to buy back the spread today.
🤖 AI Strategy Suggestion
- Badge:
HOLD— the AI has evaluated your position and recommends no action yet. - Thesis: "Trade is performing within expected variance. Delta is safely low. No adjustment required yet."
- Specific guidance: Monitor delta, target close at 70-80% profit.
A Real Example: Goldman Sachs Put Spread
Here's what the raw Fidelity transaction history looks like for a GS position:
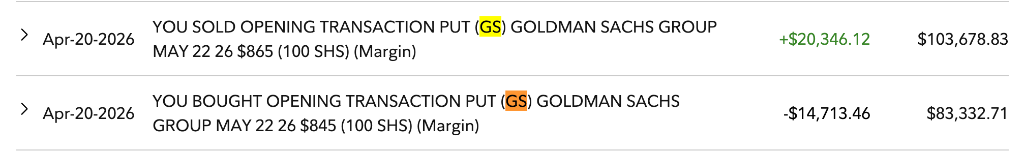
Apr-20-2026: Sold 20x GS 865P → +$20,346.12
Apr-20-2026: Bought 20x GS 845P → -$14,713.46
Net credit received: $5,632.66
That's the max profit. Full stop. No calculator required. But in Merrill Edge, you'd see two rows with symbol codes like GS#XXXXXX, both with different G/L figures, no net, no connection. You'd be back to mental math.
In OptionsMastery, this renders instantly as a single GS Vertical Put Spread card with:
- Entry Cost: -$5,632.66 ✅
- Max Profit: $5,632.66 ✅
- Current P&L based on live option mark prices
The Card Components Explained
Let me walk through each element of the strategy card and why it matters for decision-making:
Strategy Badge — Vertical Put Spread tells you the structure immediately. You know the risk profile without opening a position detail page. This matters when you have 10+ positions to review.
Leg Pills — +20 680P / -20 700P in green/red shows you long vs short at a glance. You can instantly verify the spread structure matches your intent.
% of Max Captured — This is the number brokers never show you. "I'm up $1,172 on this spread" is meaningless without context. "I've captured 25.8% of max profit" tells you whether to close early, hold, or roll. Target zones for credit spreads are typically 50-80%.
Live Stock Price — SPY at $738.65 tells you how far you are from your short strike (700P). You're 38 points OTM. That context changes your hold/close decision.
AI Action Plan — Instead of staring at numbers and wondering what to do, the system evaluates your delta exposure, days to expiration, and % of max captured, then tells you: Hold, Close, Roll, or Exit. With specific reasoning.
Time Saved. Decisions Improved.
Before OptionsMastery, reviewing a 10-position portfolio of spreads meant:
- 2-3 minutes per spread doing manual calculations
- Cross-referencing transaction history to find original credit
- Switching tabs to check live option prices
- Mentally aggregating across accounts (Fidelity + Merrill)
Total: 30-45 minutes per review session.
With the strategy card view, the same portfolio review takes under 5 minutes. Every metric is pre-computed. The AI surfaces only positions that need attention. You see the delta risk, % of max captured, and whether you're approaching assignment risk — all without opening a single options chain.
More importantly: decision quality improves. When you can see +68% of max captured next to 14 DTE, you know to close the position rather than risk theta decay reversing. That's not just time saved. That's capital preserved.
What's Next
We're continuing to push the accuracy of the spread calculation engine — handling edge cases from Fidelity's per-contract cost basis reporting, Merrill's cryptic ticker encoding, and multi-account consolidation.
If you're managing a portfolio of spreads across brokerages and spending time on manual P&L math, upload your statement to OptionsMastery and see the card view for yourself.
Your broker knows your P&L. It's just not showing it to you.
Sumeet Rana is the founder of OptionsMastery.ai, a platform built to give retail options traders institutional-grade portfolio clarity.
Ready to put this into practice?
Join OptionsMastery.ai today and let Athena instantly find the optimal strategies for your portfolio.
Start Free Trial