The Silent Portfolio Killer: Detecting & Hedging Stealth Risk Before the Crash
Why traditional stop-losses and static margin checks fail in options portfolios, and how OptionsMastery's real-time risk alert engine unmasks delta drift, gamma explosion, and volatility expansion before catastrophic margin calls.
The Silent Portfolio Killer: Detecting & Hedging Stealth Risk Before the Crash

Author: Sumeet Rana
October 2026 • Quantitative Risk Engineering Series
Executive Summary: The Non-Linear Illusion
On an ordinary Tuesday morning, an options trader checks their brokerage dashboard.
The previous evening, the portfolio looked bulletproof: a collection of high-probability cash-secured puts, iron condors, and conservative covered calls on leading tech compounders. The net portfolio delta was a modest +0.05, indicating a balanced, near-market-neutral stance. The win rate over the trailing six months was 88%.
Then, a macro catalyst hits. Overnight headline inflation comes in hotter than anticipated. Yields jump 14 basis points. The Nasdaq-100 gaps down -2.8% at the opening bell.
Within ninety minutes:
- That "+0.05 delta" portfolio silently mutates into a +0.62 levered directional long.
- Losses don't accumulate linearly—they accelerate at a terrifying exponential pace.
- Implied volatility spikes across the term structure, causing the broker's maintenance margin requirement to double.
- By 11:30 AM, before the trader can even formulate an exit plan, the brokerage liquidation algorithm initiates automated market-order buy-to-close liquidations at the exact low of the day.
The trader didn't lose money because they picked bad stocks. They were wiped out by Stealth Risk—the invisible, non-linear derivatives dynamics that standard retail broker interfaces completely obscure until it is too late.
In this deep-dive monograph, we deconstruct the mathematics of options risk, expose the three primary stealth killers, and explain how the OptionsMastery Real-Time Risk Engine provides continuous automated surveillance, score degradation alerts, and algorithmic hedging before catastrophic margin calls strike.
Why Traditional Stop-Loss Thinking Fails in Options
In equity investing, risk is linear. If you purchase 1,000 shares of Apple at $200 and set a stop-loss at $190, your downside exposure is mathematically bounded:
- Fixed Equity Delta:
Δ_equity = 1.00 (Constant) - Total Bounded Downside:
1,000 shares × ($200 - $190) = $10,000 maximum loss
Your risk does not change whether the stock drops today, tomorrow, or three weeks from now. Your loss per dollar of underlying decline is constant at $1,000 per point.
The Non-Linear Reality of Options
Options do not have constant risk. An option's value is governed by a multidimensional pricing surface modeled through partial differential equations:
Option Pricing Model:
Option Value (V) = f(Spot Price, Strike Price, Time to Expiration, Risk-Free Rate, Implied Volatility)
Where:
- S is the spot price of the underlying asset
- K is the strike price
- T is time to expiration
- r is the risk-free rate
- σ (sigma) is implied volatility
Because the options pricing equation contains non-linear dependencies on price (S), time (T), and volatility (σ), setting a simple price stop-loss on an option contract is fundamentally flawed:
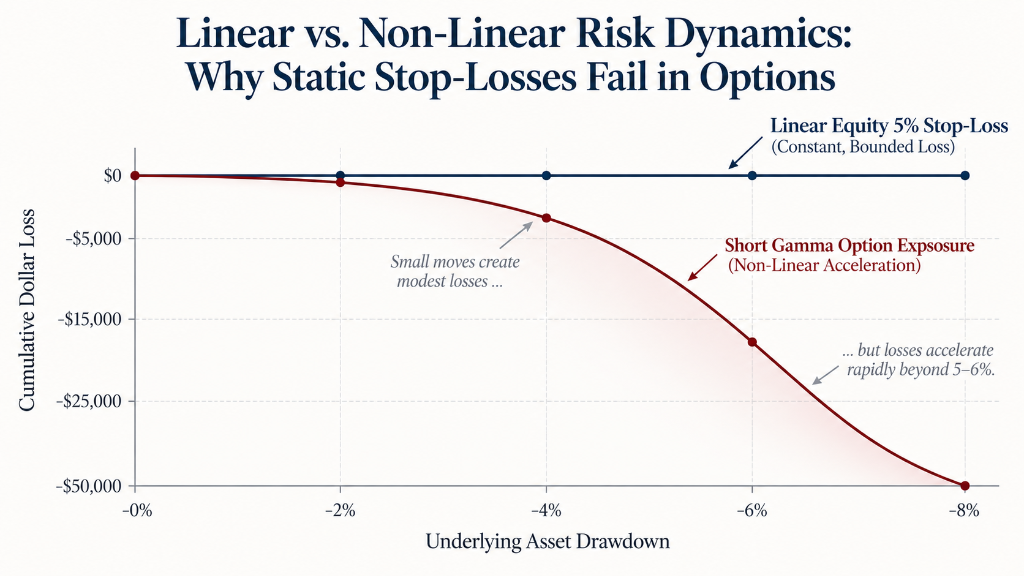
- Bid-Ask Spread Blowouts: During market gaps, option bid-ask spreads widen by 400% to 1,000%. A stop-market order triggers at the bid, instantly handing 5%–15% of slippage to institutional market makers.
- Path-Dependent Acceleration: As the underlying sells off, the sensitivity of the option to further sell-offs increases. You don't lose money at a steady pace; each additional tick down inflicts greater dollar damage than the last.
- Volatility Compounding: While a stock only loses value from price movement, a short option loses value from both price movement AND the accompanying implied volatility surge.
The 3 Stealth Killers That Wipe Out Portfolios
To protect capital against market turbulence, quantitative risk managers monitor three specific structural failure modes:
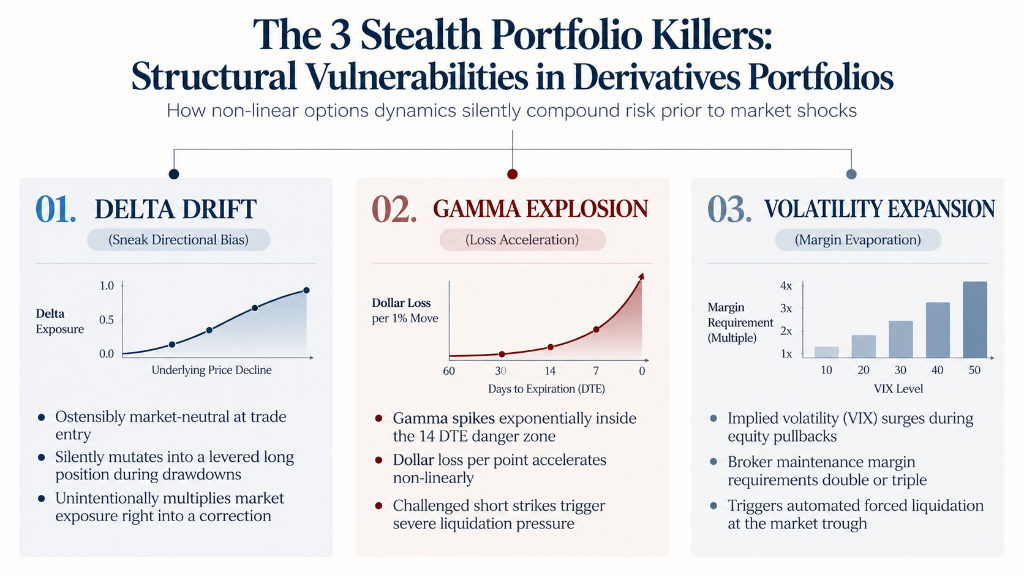
Stealth Killer #1: Delta Drift (The Sneak Directional Shift)
Delta (Δ) measures the rate of change of option value with respect to the underlying price:
Delta Sensitivity:
Delta (Δ) = ∂V / ∂S
(Rate of dollar change in option value per $1.00 move in underlying price)
For an entire portfolio of option contracts and equities, the aggregate Net Portfolio Delta is calculated by beta-weighting each position against the benchmark index (e.g., SPY or QQQ):
Net Portfolio Beta Delta:
Δ_port = Σ [ Weight_i × Delta_i × Beta_i ]
The Drift Trap:
Most income-oriented options strategies (selling out-of-the-money puts, credit spreads, iron condors) start with a low, conservative positive delta. A trader might believe they have only a +0.05 net delta, representing negligible directional bias.
However, Delta is not static. As the market drops toward the short put strike, the delta of that short put shifts from -0.10 to -0.30, and then to -0.60.
Because a short put has negative delta, and you are short the contract:
Position Delta = (-1) × (-0.60) = +0.60 Long Delta exposure
Your portfolio delta silently drifts higher precisely when the market is falling. Without buying a single new contract, your portfolio has metamorphosed into an aggressively levered long position right into the teeth of a market correction.
Stealth Killer #2: The Negative Gamma (Γ) Explosion
If Delta is velocity, Gamma (Γ) is acceleration. Gamma represents the second derivative of the option price with respect to the underlying spot price:
Gamma Acceleration:
Gamma (Γ) = ∂Δ / ∂S = ∂²V / ∂S²
(The rate at which Delta changes per $1.00 move in spot price)
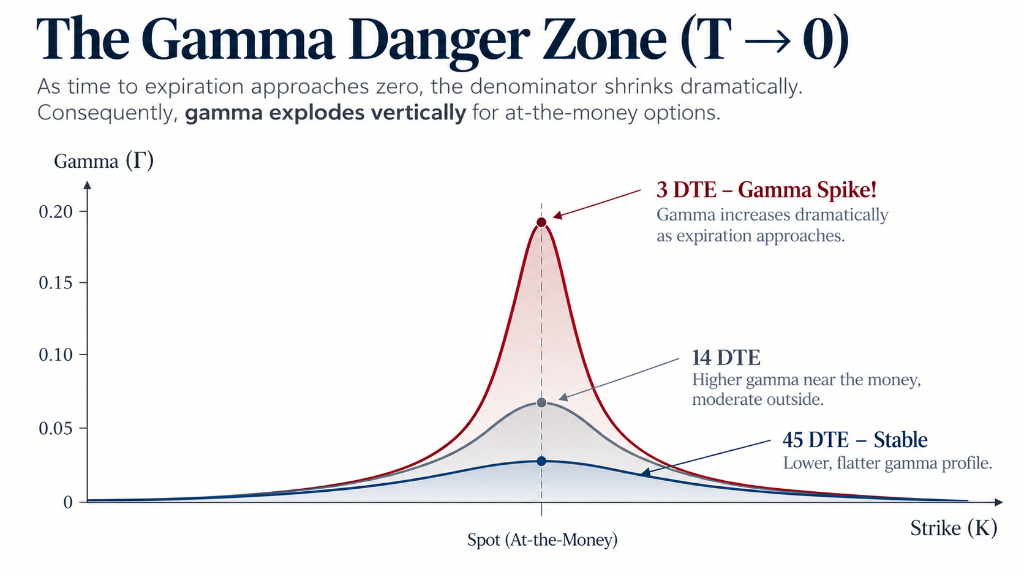
In quantitative options pricing, Gamma is scaled inversely by time and volatility:
Gamma (Γ) = N'(d₁) / [ S × σ × √T ]
(Where N'(d₁) is standard normal density, S is spot price, σ is volatility, and T is time to expiration)
As time to expiration approaches zero (T → 0), the denominator shrinks dramatically. Consequently, Gamma explodes vertically for at-the-money options:
Why Retail Traders Get Squeezed:
Retail traders love selling short-dated options (7 DTE to 14 DTE) because the annualized Theta (Θ) decay appears high. But the trade-off is catastrophic negative gamma.
When a short option with 5 DTE is challenged:
- If the underlying drops by $1, your position loses $15.
- If it drops another $1, your position loses $45.
- If it drops another $1, your position loses $120.
This exponential convexity is why selling short-dated unhedged options is famously compared to "picking up pennies in front of a steamroller." When gamma explodes against you, no human trader can place stop-loss orders fast enough to halt capital destruction.
Stealth Killer #3: Volatility Expansion (ν) & The Margin Call Spiral
Vega (ν) measures the sensitivity of option value to a 1% change in implied volatility:
Vega Sensitivity:
Vega (ν) = ∂V / ∂σ = S × √T × N'(d₁)
(The dollar change in contract value for every 1.0% shift in Implied Volatility)
Under normal market conditions, implied volatility remains stable or drifts down slowly. But in derivatives markets, price and volatility are inversely correlated (the volatility skew phenomenon). When equities plunge, implied volatility explodes higher.
                           THE BROKER MARGIN CALL SPIRAL
                                         │
                     [Market Suffers Sudden -3% Pullback]
                                         │
                                         ▼
                     ┌───────────────────────────────────────┐
                     │   Implied Volatility (VIX) Surges     │
                     │   Vega expands option contract value  │
                     └───────────────────┬───────────────────┘
                                         │
                                         ▼
                     ┌───────────────────────────────────────┐
                     │   TIMS / Reg-T Margin Requirements    │
                     │   Broker recalculates worst-case risk │
                     │   Margin requirement doubles (2x-3.5x)│
                     └───────────────────┬───────────────────┘
                                         │
                                         ▼
                     ┌───────────────────────────────────────┐
                     │   AUTOMATED BROKER LIQUIDATION        │
                     │   Forced market orders buy to close   │
                     │   Losses locked at market nadir       │
                     └───────────────────────────────────────┘
The TIMS Margin Trap:
Brokers do not calculate margin based on yesterday's calm volatility. Under FINRA Rule 4210 and the OCC's Theoretical Intermarket Margin System (TIMS), maintenance margin is dynamically recalculated based on stress tests of ±8% to ±15% market shocks.
When the VIX spikes from 14 to 30:
- Short option prices surge purely from Vega, even if the strike has not yet been touched.
- The broker's stress algorithm projects a substantially larger potential loss.
- Margin requirements increase by 150% to 350%.
- The trader receives a sudden margin deficit notification requiring immediate wire transfer.
- If unfulfilled within hours, the broker liquidates positions into an illiquid market, crystallizing devastating losses at the absolute bottom.
The Earnings Gauntlet: The Calendar Risk Nobody Models

Beyond Greeks, the most common operational blunder in self-directed options trading is the Earnings Gauntlet—holding short options across unmonitored quarterly earnings announcements.
An earnings announcement is an information singularity:
- Historical average earnings gap for tech equities: ±7.5% to ±16.2%.
- Post-earnings volatility crush: Implied volatility collapses by 40%–70% immediately following the release.
If you are long options into earnings, IV crush destroys your premium even if the stock moves in your anticipated direction.
If you are short unhedged options into earnings, an outsized 3σ gap move (such as a 20% opening gap) completely blows past protective strikes, triggering immediate assignment or catastrophic loss.
How OptionsMastery Solves Stealth Risk: The Automated Defense Engine
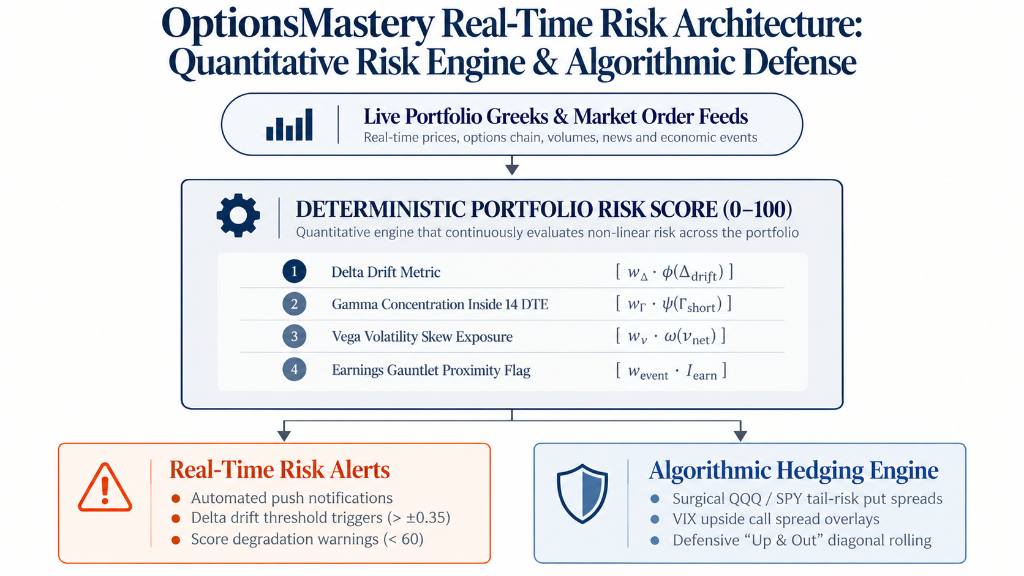
To solve the limitations of conventional broker dashboards, OptionsMastery built an institutional-grade, continuous risk engine that unmasks stealth risk in real time.
1. Deterministic Portfolio Risk Scoring (0–100 Scale)
Rather than forcing traders to calculate dozens of cross-asset Greeks manually, OptionsMastery synthesizes multi-dimensional risk into a clean, deterministic Portfolio Health Score:
Deterministic Risk Score Formulation (0–100 Scale):
Portfolio Risk Score = 100 - [ (w_Δ × Delta Drift) + (w_Γ × Gamma Inside 14 DTE) + (w_ν × Vega Skew Penalty) + Event Proximity ]
(Where weights calibrate penalization based on account equity, margin utilization, and days-to-expiration)
Three Strict Score Tiers:
- 80 – 100 (Resilient / Optimal): Portfolio Greeks are balanced; net beta delta is within ±0.15; no short options are inside the 14 DTE Gamma Danger Zone; zero unhedged earnings exposures.
- 60 – 79 (Warning / Delta Drift Detected): Delta drift has crossed acceptable bounds; gamma exposure is concentrating near expiration; the portfolio is becoming vulnerable to market pullbacks.
- < 60 (Critical Action Mandate): High negative gamma clustered within 14 DTE combined with impending earnings or high Vega expansion. The system immediately generates surgical hedging directives.
2. Automated Real-Time Risk Alerts
OptionsMastery monitors portfolio health continuously during market hours. The moment risk thresholds are violated, the platform issues real-time alerts:
[!WARNING] DELTA DRIFT ALERT: Portfolio Beta-Weighted Delta shifted from +0.06 to +0.44 following Nasdaq morning decline. Directional exposure exceeds safe tolerance. Rebalancing recommended.
[!CAUTION] GAMMA DANGER ZONE TRIGGERED: Short NVDA $125 Put contract has entered 7 DTE with Spot at $126.20. Gamma acceleration factor is 4.8x. High assignment risk.
[!IMPORTANT] EARNINGS GAUNTLET DETECTED: You hold short options on SMCI expiring October 16. Corporate earnings release scheduled for October 15. Immediate strike-rolling or closure recommended.
3. The Algorithmic Hedge Recommender
When risk degrades, the engine doesn't just display warnings—it calculates the exact, capital-efficient counter-positions required to neutralize exposure:
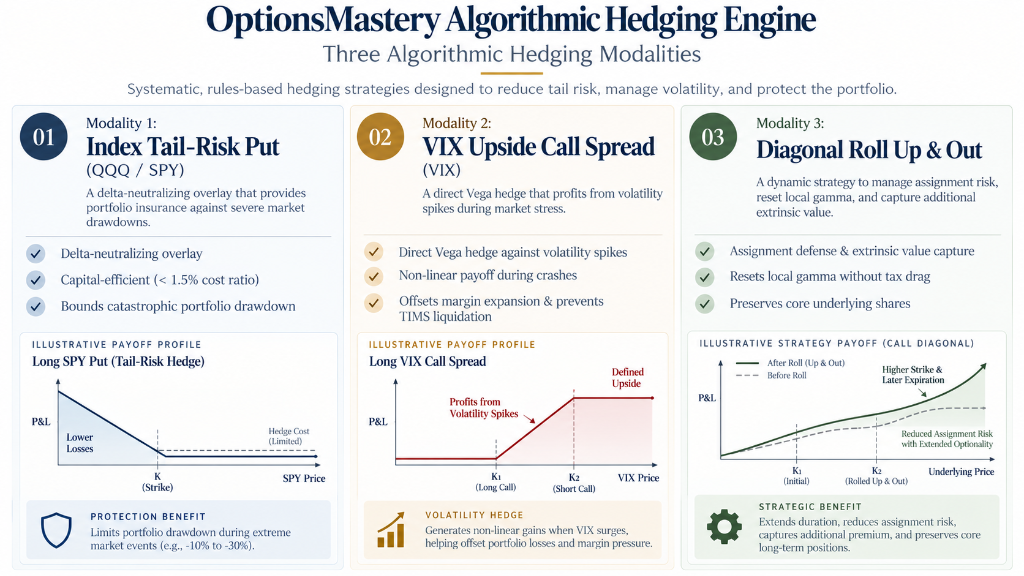
- Index Tail-Risk Debit Spreads: Instead of buying expensive at-the-money puts, the engine models asymmetric out-of-the-money debit spreads on QQQ or SPY. By risking 1.0% to 1.5% of portfolio value, the position caps overall portfolio drawdown at -8% to -10%.
- VIX Upside Call Spreads: To defend against the Margin Call Spiral, the engine recommends VIX call spreads. When equity markets crash, VIX spikes violently, generating a sudden cash influx that satisfies broker margin requirements and prevents forced liquidations.
- The Diagonal Roll Protocol ("Up and Out" / "Down and Out"): When an individual short strike is under pressure, the engine calculates whether to roll the position to a further expiration and more favorable strike for a net credit, extending time horizon (√T) and dramatically lowering local Gamma.
Live Case Study: The 72-Hour Market Shock Simulation

To demonstrate the real-world impact of automated risk surveillance, we modeled two identical $250,000 portfolios navigating a sudden -4.5% market correction over a 72-hour period.
Initial Portfolio Composition:
- 60% Core Compounders (AAPL, MSFT, NVDA, AMZN)
- 40% Systematic Cash-Secured Puts and Covered Calls (30–45 DTE)
- Starting Beta Delta: +0.08
- Starting Portfolio Risk Score: 88 / 100
Performance Comparison Across the 72-Hour Shock
| Metric / Event | Portfolio A: Standard Retail Brokerage | Portfolio B: OptionsMastery Automated Defense |
|---|---|---|
| Day 1: Market Drops -1.8% | Trader takes no action; assumes low delta protects them. Delta drifts from +0.08 to +0.28. | 10:15 AM: Delta Drift Alert triggers. Portfolio Risk Score drops to 71. Trader receives notice of emerging directional bias. |
| Day 2: Market Drops -2.7% (Gap Down) | NVDA short put enters 6 DTE; Gamma spikes 5x. Portfolio Delta surges to +0.65. Unhedged losses compound to -$18,400. | 9:35 AM: Critical Alert (< 60 Score). Algorithmic Hedge deployed: QQQ Out-of-the-Money Bear Put Spread purchased for $850. Short put rolled to 35 DTE for a net credit. |
| Day 3: VIX Spikes to 34 | Broker TIMS margin requirement surges +220%. Margin call issued. Broker liquidates challenged puts at intraday low. | QQQ hedge gains +$9,200. VIX expansion offset by diagonal rolls. Margin remains stable with 42% excess liquidity cushion. |
| Total Drawdown | -$38,600 (-15.4%)<br>Permanent capital impairment from forced liquidation. | -$4,250 (-1.7%)<br>Drawdown arrested; positions intact for subsequent rebound. |
| Recovery Time | 14 months required to recover lost capital. | 11 trading days to achieve new equity all-time highs. |
The 5 Golden Rules of Derivatives Risk Defense
┌─────────────────────────────────────────────────────────────────────────────┐
│                   THE 5 COMMANDMENTS OF OPTIONS RESILIENCE                  │
├─────────────────────────────────────────────────────────────────────────────┤
│ 1. Never hold short unhedged options inside 14 DTE without a delta budget.  │
│ 2. Audit beta-weighted portfolio delta at least twice per trading session.  │
│ 3. Never allow a short contract to cross an unhedged earnings announcement. │
│ 4. Pre-structure asymmetric tail-risk hedges before implied volatility pops.│
│ 5. Treat a Portfolio Risk Score drop below 60 as an immediate halt order.   │
└─────────────────────────────────────────────────────────────────────────────┘
Conclusion: Turning Vulnerability into an Institutional Fortress
Options trading is one of the most powerful wealth-creation mechanisms in modern financial markets—allowing investors to generate high synthetic yields, monetise structural market inefficiencies, and hedge downside risks.
However, options are non-linear derivatives. Managing them using primitive, linear stock rules is a recipe for catastrophic failure. Delta drift, gamma explosion, and volatility expansion work together in silence until the moment of market stress, transforming small pullbacks into portfolio-destroying margin calls.
By pairing systematic options strategies with OptionsMastery's continuous risk surveillance, real-time alert triggers, and algorithmic hedging, you take the same defensive playbook used by top quantitative hedge funds and place it directly on your personal dashboard.
Don't wait for the next market crash to find out where your stealth risks are hidden.
Put This Architecture to Work Today
Connect your brokerage account to OptionsMastery.ai and run an instant, comprehensive Portfolio Risk Diagnostic. Within 30 seconds, Athena and the Quantitative Risk Engine will:
- Calculate your aggregate Beta-Weighted Net Delta and Gamma exposure
- Identify any short contracts trapped in the 14 DTE Gamma Danger Zone
- Scan all holdings for pending Earnings Gauntlets
- Assign your definitive 0–100 Portfolio Risk Score with actionable hedging recommendations
Ready to put this into practice?
Join OptionsMastery.ai today and let Athena instantly find the optimal strategies for your portfolio.
Start Free Trial