Black-Scholes Payoff Redesign, Visual Earnings Gauntlets, & AI Success Loops
A major platform update: dynamic Multi-DTE payoff curves, responsive Earnings Gauntlet Gantt charts, and user-adaptive AI recommendation engines.
Black-Scholes Payoff Redesign, Visual Earnings Gauntlets, & AI Success Loops
We are thrilled to announce a major upgrade to the OptionsMastery platform, bringing institutional-grade modeling tools, advanced visual timelines, and deep performance-tuning integrations to your portfolio analysis workflow.
Here is a breakdown of what is new, improved, and live in this release:
📈 1. Black-Scholes Payoff Visualizer Overhaul
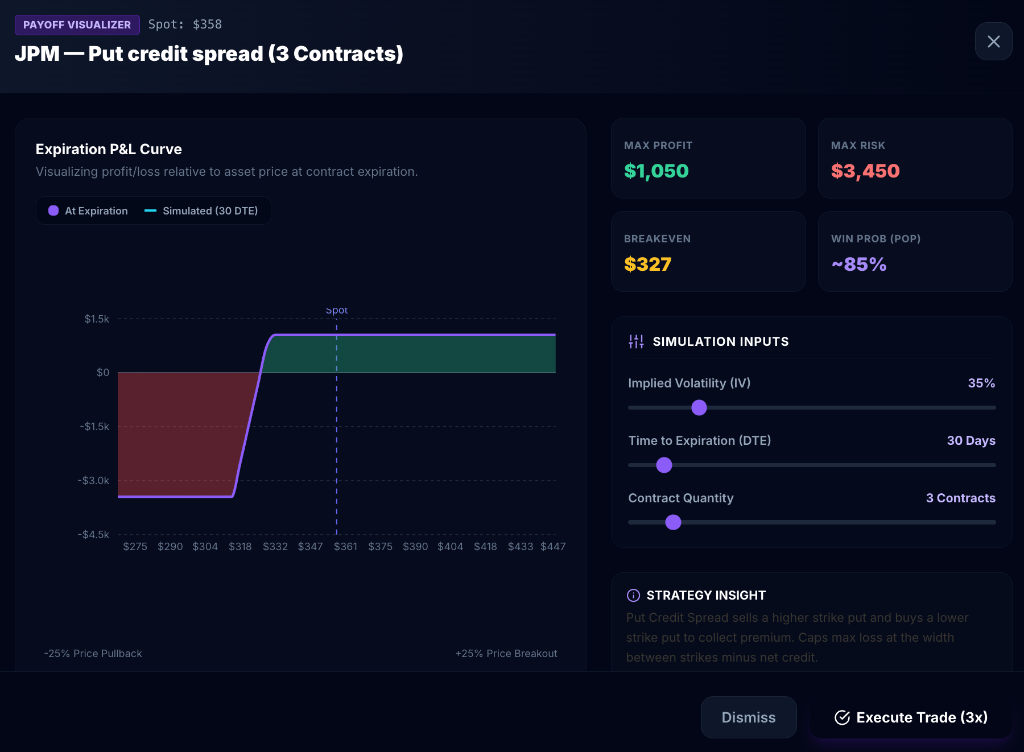
We have completely redesigned the option payoff visualizer, moving beyond static expiration boundaries to show dynamic time-decay (Theta) progression:
- Simulated Remaining DTE Curve (Glowing Cyan Line): A Black-Scholes model now simulates your option strategy's paper P&L at any intermediate point in time. Use the interactive Time to Expiration (DTE) slider to watch the curve morph as Theta decays toward the expiration boundary.
- Split Profit/Loss Area Shading: The chart automatically computes the exact zero breakeven fraction, rendering the profit zone in vibrant green and the loss zone in warning red.
- Premium & Strike Sanitization: Comma-separated premiums (e.g.
"$1,100") and range midpoints are now parsed correctly. Strike prices are automatically sanitized to filter out contracts, years, or contract count strings. - Negative Value Margins: Adjusted visual margins to prevent negative numbers on the Y-axis from getting cropped, with compact formatting (e.g.
-$40.0k) for clean scaling.
⏳ 2. Visual Earnings Gauntlet Gantt Chart
To help you manage the golden rule—no short premium through an earnings print—we have added a visual Gantt chart to the Earnings Gauntlet dashboard:
- Interactive 75-Day Timeline: A responsive CSS grid maps standard date ticks (Today, Aug 10, Aug 21, Sep 2, Sep 18, Sep 29, Oct 16) and vertical grid markers dynamically.
- Spans vs. Clears Color Coding:
- Spans Print (Red Bar): If an active option position (specifically a short premium contract) overlaps with or expires after its scheduled earnings date, the timeline bar is filled with a red gradient, signaling action is required.
- Clears Print (Grey Bar): If the contract expires safely before the earnings print, it renders in slate grey.
- Confirmed Earnings Pins: Distinct vertical pins with red dots mark the exact date of upcoming earnings prints, with interactive tooltips showing the calendar details.
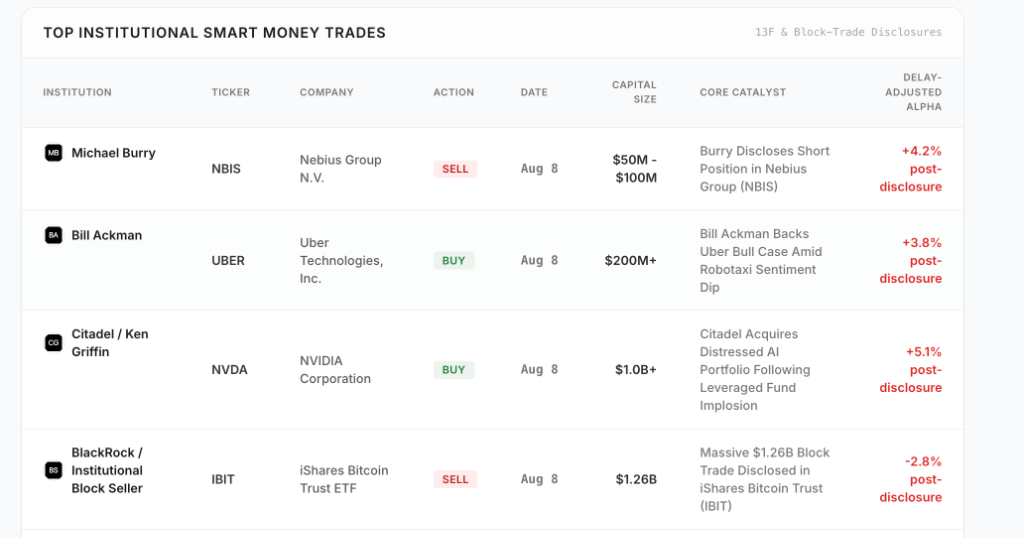
🐋 3. Expanded Smart Money Flows (Top 20)
We have expanded the AI-driven smart money scanner to fetch and display the most significant block transactions in the market:
- AI Signal Optimization: The news scanner now extracts the top 15 to 20 capital flows (up from 5–8) and actively filters out minor insider noise.
- Elite Institution Focus: Prioritizes trades from high-authority whales (Citadel, Point72, Berkshire Hathaway, Renaissance Technologies, Jane Street, BlackRock, Vanguard) and legislative filers (e.g. Nancy Pelosi).
- Top 20 Grid: Expanded the frontend list view capacity from 10 to 20 rows, and added a robust local seed database of 25 high-volume institutional block trades.
🔄 4. AI Success Feedback Loop & Prompt Guardrails
Your historical options success rate now directly guides the portfolio recommender engine:
- Success Loop Integration: The AI analysis engine now parses your trade records. If enabled, the system injects strict overrides telling the LLM to prioritize strategies you win on (e.g. Put Credit Spreads or CSPs) and minimize strategies you lose on (e.g. Covered Calls).
- Default Balance: If disabled, a default preference prompts the model to recommend high-probability credit spreads and puts instead of oversaturating your suggestions list with covered calls.
- Strict Exclusions: The recommender is now blocked from suggesting options positions that expire within 7 days of upcoming earnings, and "Existing" recommendations are strictly constrained to assets you already own in your portfolio.
- UI Fixes: Refined the "Long LEAP" column to dynamically display "Buy LEAP" for new opportunities and "Existing LEAP" for active portfolio overlays, preventing confusion about your active holdings.
📊 5. Long-Term Market Valuation Models (Buffett Indicator & CAPE Ratio)
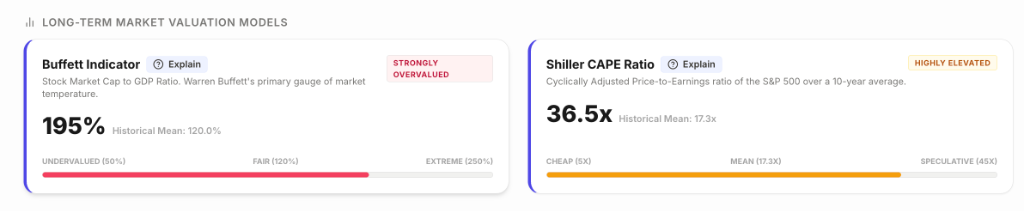
We added the Buffett Indicator and Shiller CAPE Ratio models at the top of the Market Data page:
- Buffett Indicator (Stock Market Cap to GDP): Compares the total value of all public U.S. equities with the size of the national economy. Warren Buffett's primary gauge of market temperature. Currently sits in the "Strongly Overvalued" range at 195%.
- Shiller CAPE Ratio (Cyclically Adjusted PE): Smooths out earnings over a 10-year period, adjusting for inflation to filter out short-term economic cycles. Currently highly elevated at 36.5x.
- Dynamic Calibration: These models scale dynamically in real-time as the S&P 500 moves, and feature expandable McKinsey-style drawer cards explaining what they mean, their historical boundaries, and formulas.
Deployed and Live
All updates are live on the main branch and have passed automated TypeScript compilation. Simply reload the page, toggle the AI Success Feedback Loop in Preferences, and check out the new Earnings Gauntlet to see these changes in action!
Ready to put this into practice?
Join OptionsMastery.ai today and let Athena instantly find the optimal strategies for your portfolio.
Start Free Trial